
Observability basics for operators: build reliable systems
Observability gives operators the evidence they need to understand Kubernetes systems and respond to failure. Operators combine metrics, logs and traces with clear control loops to detect problems, explain their causes and restore reliable service.
A Kubernetes operator should expose its own health, reconciliation activity and failures through consistent monitoring signals. This gives SRE and DevOps teams a practical view of both the workloads they manage and the control logic that keeps those workloads aligned with their desired state.
Key takeaways
- Observability connects metrics, logs and traces to operational decisions.
- Operators need clear signals for health, reconciliation and failure.
- Scalable monitoring depends on useful alerts and controlled data flows.
The signals and control loops that matter
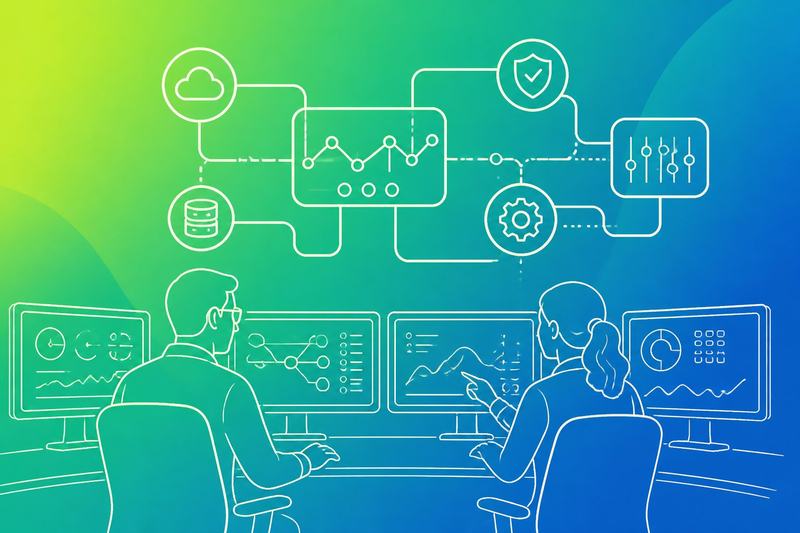
Operators need telemetry that connects workload behaviour to an action. Metrics show condition and change, logs explain individual events and traces connect requests across distributed systems. A useful control loop turns those signals into a named decision, an operator action and evidence that the action changed the system.
Metrics for operator and managed workload health
Metrics should expose both the operator and the workload it manages. In Kubernetes, operators commonly track reconciliation rate, duration, errors, workqueue depth and retry counts. controller-runtime metrics can show whether reconciliation is progressing or repeatedly failing.
Managed workload metrics must cover traffic, latency, errors and saturation. Prometheus metrics should separate successful and failed requests, distinguish 4xx from 5xx responses and avoid treating fast failures as healthy latency. Queue depth, resource usage, connection pools and consumer lag reveal pressure that request metrics may miss.
Labels need deliberate limits. A label such as namespace or workload can support diagnosis, while an unbounded request ID or user ID can create excessive cardinality. Each alert should identify the threshold, affected object and operator action. A metric without that context remains telemetry data, not operational control.
Logs and traces for reconciliation failures
Metrics can show that reconciliation fails, but logs usually explain why. Structured logging should record the controller name, namespace, object name, generation, observed generation, result, error class and retry decision. It should avoid dumping entire objects or credentials. Consistent fields let operators filter logs across replicas and correlate one failure with related events.
Distributed tracing adds timing and causality. OpenTelemetry instrumentation can create spans for queue handling, API reads, external calls and status updates. The OpenTelemetry Collector can receive OTLP data, apply filtering or enrichment and forward it to the selected backends.
A trace should connect the reconciliation attempt to the external operation that failed. Operators can then distinguish a Kubernetes API delay from a cloud API rejection or an application timeout. Logs provide detail, metrics show frequency and traces expose the path through the system.
From alerting to actionable troubleshooting
An alert should represent a condition that requires a decision, not merely a high-volume signal. It should state the affected service or managed object, the observed condition, the duration and the first diagnostic query. Alert routing should send platform failures to the responsible operator and workload failures to the owning team.
A practical troubleshooting path follows the control loop:
- Check traffic, error rate, latency and saturation.
- Check reconciliation errors, queue depth and retry activity.
- Inspect structured logs for the affected object and generation.
- Follow the trace across Kubernetes, the operator and external dependencies.
- Record the action and verify the next metric or status change.
Operators should test this path with a synthetic failure. The drill must produce attributable evidence, a named action and a visible recovery signal. This validates observability as an operating mechanism rather than a collection of dashboards.
Building an observable operator

An observable operator exposes reconciliation health, resource state and access activity without weakening control-plane security. It combines consistent Go instrumentation with useful Kubernetes conditions, trace context and narrowly scoped telemetry access.
Instrumenting Go reconcilers with Prometheus and OpenTelemetry
A Go reconciler built with controller-runtime should record work at clear boundaries: reconciliation duration, outcomes, retries, API errors and active workers. Prometheus metrics should use stable names and bounded labels such as controller, namespace-independent result and operation. Resource names, request IDs and arbitrary error text do not belong in labels because they create unbounded cardinality.
OpenTelemetry adds distributed traces across HTTP and gRPC calls, admission webhooks and external services. The reconciler should propagate context through client calls and record span status when it returns an error. It should not expose secrets or full custom resource contents in spans. Grafana can combine Prometheus dashboards with trace links, while the Operator SDK observability guidance covers operator-specific instrumentation concerns.
Designing custom resources, status and conditions
Custom resource definitions, or CRDs, should separate desired configuration in spec from observed state in status. The operator should enable the status subresource and update status through the status client rather than rewriting the complete object. Kubernetes conditions should use stable types such as Ready, Progressing and Degraded, with status, reason, message, observedGeneration and transition time.
Conditions give users and automation a durable state contract. The reconciler should set observedGeneration only after it has processed the current specification, preserve useful failure reasons and avoid replacing a meaningful condition with a generic error. Watches, predicates and owner references should limit reconciliation to relevant changes. Finalizers must report blocked deletion clearly and remove themselves only after cleanup succeeds. Server-side apply, or SSA, helps separate field ownership when multiple controllers modify a resource.
Securing telemetry endpoints and access
An operator should expose metrics on a dedicated HTTP endpoint, usually bound to a non-public interface, and keep health probes separate from diagnostic data. A ServiceMonitor from the Prometheus Operator can discover metrics, but its namespace, labels and scrape credentials need deliberate configuration. TLS should protect telemetry that crosses trust boundaries.
RBAC should grant only the permissions required for reconciliation and telemetry. A ClusterRoleBinding to cluster-admin is rarely justified. The Kubernetes API server, Prometheus and Grafana should authenticate independently, with network policy limiting who can reach the metrics service. Leader election prevents duplicate active reconcilers, but every replica still needs safe endpoints and correct RBAC. Operators created with Kubebuilder or the Operator SDK should review generated YAML before deployment, especially service accounts, roles and webhook certificates.
Operating the monitoring stack at scale
A reliable stack separates resource metrics, application telemetry and operational workflows. Operators need accurate Kubernetes state, searchable logs, trace context, durable storage and alerts that lead to an action.
Collecting cluster and resource metrics
The kubelet exposes node and pod statistics through cAdvisor, including CPU usage, memory consumption and container restart data. Prometheus can scrape these endpoints for cluster monitoring, while kube-state-metrics turns Kubernetes object state into metrics such as replica availability, pending pods and deployment conditions.
metrics-server serves short-lived resource metrics through the Metrics API. Its APIService must remain healthy because the Horizontal Pod Autoscaler (HPA) uses this path for CPU and memory-based autoscaling. Metrics Server supports current utilisation decisions, but it does not replace Prometheus for historical analysis, dashboards or alerting.
Operators should define retention and scrape intervals according to query needs and system performance. They should also protect metric endpoints, limit high-cardinality labels and alert on failed scrapes, missing kubelets and unavailable API services.
Centralising logs and distributed traces
A node-level collector such as Fluent Bit can read container logs, add Kubernetes metadata and forward records to Loki or Elasticsearch. Fluentd can provide richer processing where routing, buffering or transformation requirements justify its larger footprint. Teams should standardise fields such as namespace, pod, container, application and severity.
Trace instrumentation should propagate W3C trace context across service boundaries. Jaeger or Tempo can store and query traces, while sampling controls ingestion cost. Operators should retain errors and slow requests at a higher rate than routine successful traffic, provided the sampling policy matches incident requirements.
Logs and traces need aligned timestamps, stable service names and links from dashboards to representative records. Access controls should prevent sensitive fields from reaching shared indexes or long-term storage.
Installation, scaling and day-two operations
A Helm deployment can provide a repeatable starting point for Prometheus, Alertmanager, Grafana and supporting exporters. An operator managed through the Operator Lifecycle Manager (OLM) or OperatorHub can automate upgrades and custom resources, including deployments based on the Observability Operator in OpenShift Container Platform.
Operators should define persistent volumes, scheduling constraints, resource requests, retention and backup procedures before production use. Thanos can provide durable, federated Prometheus data for multiple clusters, but it adds object storage, query and compaction components that also require monitoring.
A CI/CD pipeline should validate alert rules, dashboards and scrape configuration before rollout. Teams running kind can test manifests locally with kubectl, then verify pod health, endpoints and kubectl logs output in a representative cloud or on-premises environment. Alertmanager routing should distinguish actionable pages from tickets and informational notifications.
Frequently asked questions
Operators need visibility into system behaviour, not just signs of failure. Effective practice connects metrics, logs and traces with clear ownership, useful context and dependable alerting.
What is observability and why does it matter for operators?
Observability describes how well operators can infer a system’s internal state from its external outputs. Those outputs usually include metrics, logs and traces.
It matters because distributed systems can fail across service, network and infrastructure boundaries. Good observability helps operators identify the affected component, follow a request path and separate symptoms from causes.
What is the difference between observability and monitoring?
Monitoring measures known conditions against defined thresholds or expected ranges. It commonly answers questions such as whether a service is available, whether latency is rising or whether storage is filling.
Observability supports investigation when the failure mode is not known in advance. Monitoring provides detection, while observability provides the context needed to explain behaviour.
What are the core pillars of observability?
The traditional pillars are:
- Metrics: Numeric measurements recorded over time, such as request rate, error rate, latency and resource use.
- Logs: Timestamped records of events, ideally structured and enriched with fields such as service name, severity and request ID.
- Traces: Records of a request’s path through distributed services, including spans for individual operations.
The three signals work together. A metric can identify a latency increase, a trace can show which service adds delay and a log can provide the relevant error details.
Kubernetes documentation describes observability through these three signals and explains how cluster components and add-ons emit them (Kubernetes observability concepts).
Which metrics, logs and traces should operators collect first?
Operators should begin with service health and user impact:
- Request rate, error rate and latency
- Availability of critical endpoints
- Saturation of CPU, memory, storage and network resources
- Pod restarts, scheduling failures and readiness changes
- Control plane and node health
- Structured logs for failures, warnings and lifecycle events
- Traces for important user journeys and cross-service calls
Each signal needs consistent identity fields. Service, namespace, workload, environment, version and request or trace identifiers help operators connect evidence without guessing.
Operators should control cardinality and retention from the start. Unbounded labels, full request bodies and sensitive fields can increase cost and create security risks.
How does OpenTelemetry support observability?
OpenTelemetry provides vendor-neutral APIs, SDKs, collectors and instrumentation patterns for generating and processing telemetry. It supports metrics, logs and traces, allowing applications and infrastructure components to use a common data model and export path.
An operator can deploy or configure collectors near workloads, at node level or as a central gateway. The collector can receive telemetry, apply processing such as filtering or attribute enrichment and export it to one or more back ends.
OpenTelemetry does not provide the complete storage, query or visualisation layer by itself. Operators still need to define destinations, access controls, sampling, retention and failure behaviour.
What should operators look for when choosing an observability tool?
A tool should match the system’s boundaries and operating model. Operators should assess:
- Support for metrics, logs and traces
- Kubernetes discovery and workload metadata
- OpenTelemetry compatibility
- Correlation through trace IDs, labels and structured fields
- Alert routing, silencing and escalation controls
- Query performance at the required retention period
- Access control and tenant isolation
- Data residency, encryption and audit capabilities
- Collection failure handling and back-pressure behaviour
- Deployment, upgrade and recovery procedures
- Cost controls for ingestion, storage and cardinality
The Cluster Observability Operator can create independently configurable monitoring stacks for different services and users on OpenShift (Cluster Observability Operator documentation). Operators should still verify its supported platform version, integration boundaries and operational requirements before adopting it.
Run this check
See how a site measures up on the basics before you act on any of this. Get a free website audit: enter a URL and an email, and we check the public pages on our servers, never logging in and never touching your files. The findings come back with the page, the reason and the fix.